
The Risk Framework | Part Three - When Active Hedging Is Actually Worth the Cost
Most investors think about hedging at the wrong time, with the wrong tools, for the wrong reasons. Here is a framework for doing it correctly.

If you haven’t explored our previous research, you may revisit some of our earlier due diligence reports and thematic notes below. Each piece reflects the same thesis-driven framework we apply across every investment case.


Consider the contrast between two investors entering 2020.
Investor A had been monitoring the VIX/VXV ratio through late 2019, noticed it declining toward 0.85, and observed the Fear and Greed Index consistently above 75 through Q4 2019. In December 2019, with VIX at 12 and PCR near its lowest level in three years, she purchased six-month SPY puts at a cost of approximately 0.4% of her portfolio value.
Investor B noticed the same low VIX and concluded that markets were calm and protective options were unnecessary. In mid-February 2020, as COVID news began emerging, she noticed the VIX starting to rise and considered buying puts. By March 2020, with VIX at 82, any meaningful protection had become prohibitively expensive.
Investor A’s puts, purchased in December 2019 for 0.4% of portfolio value, provided significant protection during the March crash. Investor B’s decision to wait until the risk was obvious left her with the choice between accepting the full drawdown or paying five times the price for protection that arrived too late.
Opening
Consider a simple arithmetic problem.
From 2015 through 2024, the S&P 500 delivered a CAGR of approximately 13%. If you had spent 1% of your portfolio value each year on SPY Put Options as continuous downside protection, your net CAGR would have been reduced to roughly 12%. That sounds like a small price for peace of mind. But compounded over ten years, that 1% annual drag reduces a $100 portfolio’s final value from $340 to $310. You paid $30 for insurance against losses that, in eight of those ten years, never arrived.
In 2020 and 2022, those puts would have delivered real value. In 2015, 2016, 2017, 2018, 2019, 2021, 2023, and 2024, they were pure cost. The math of continuous hedging is almost always negative. Protection purchased when it is not needed is not prudent risk management. It is a recurring tax on compounding.
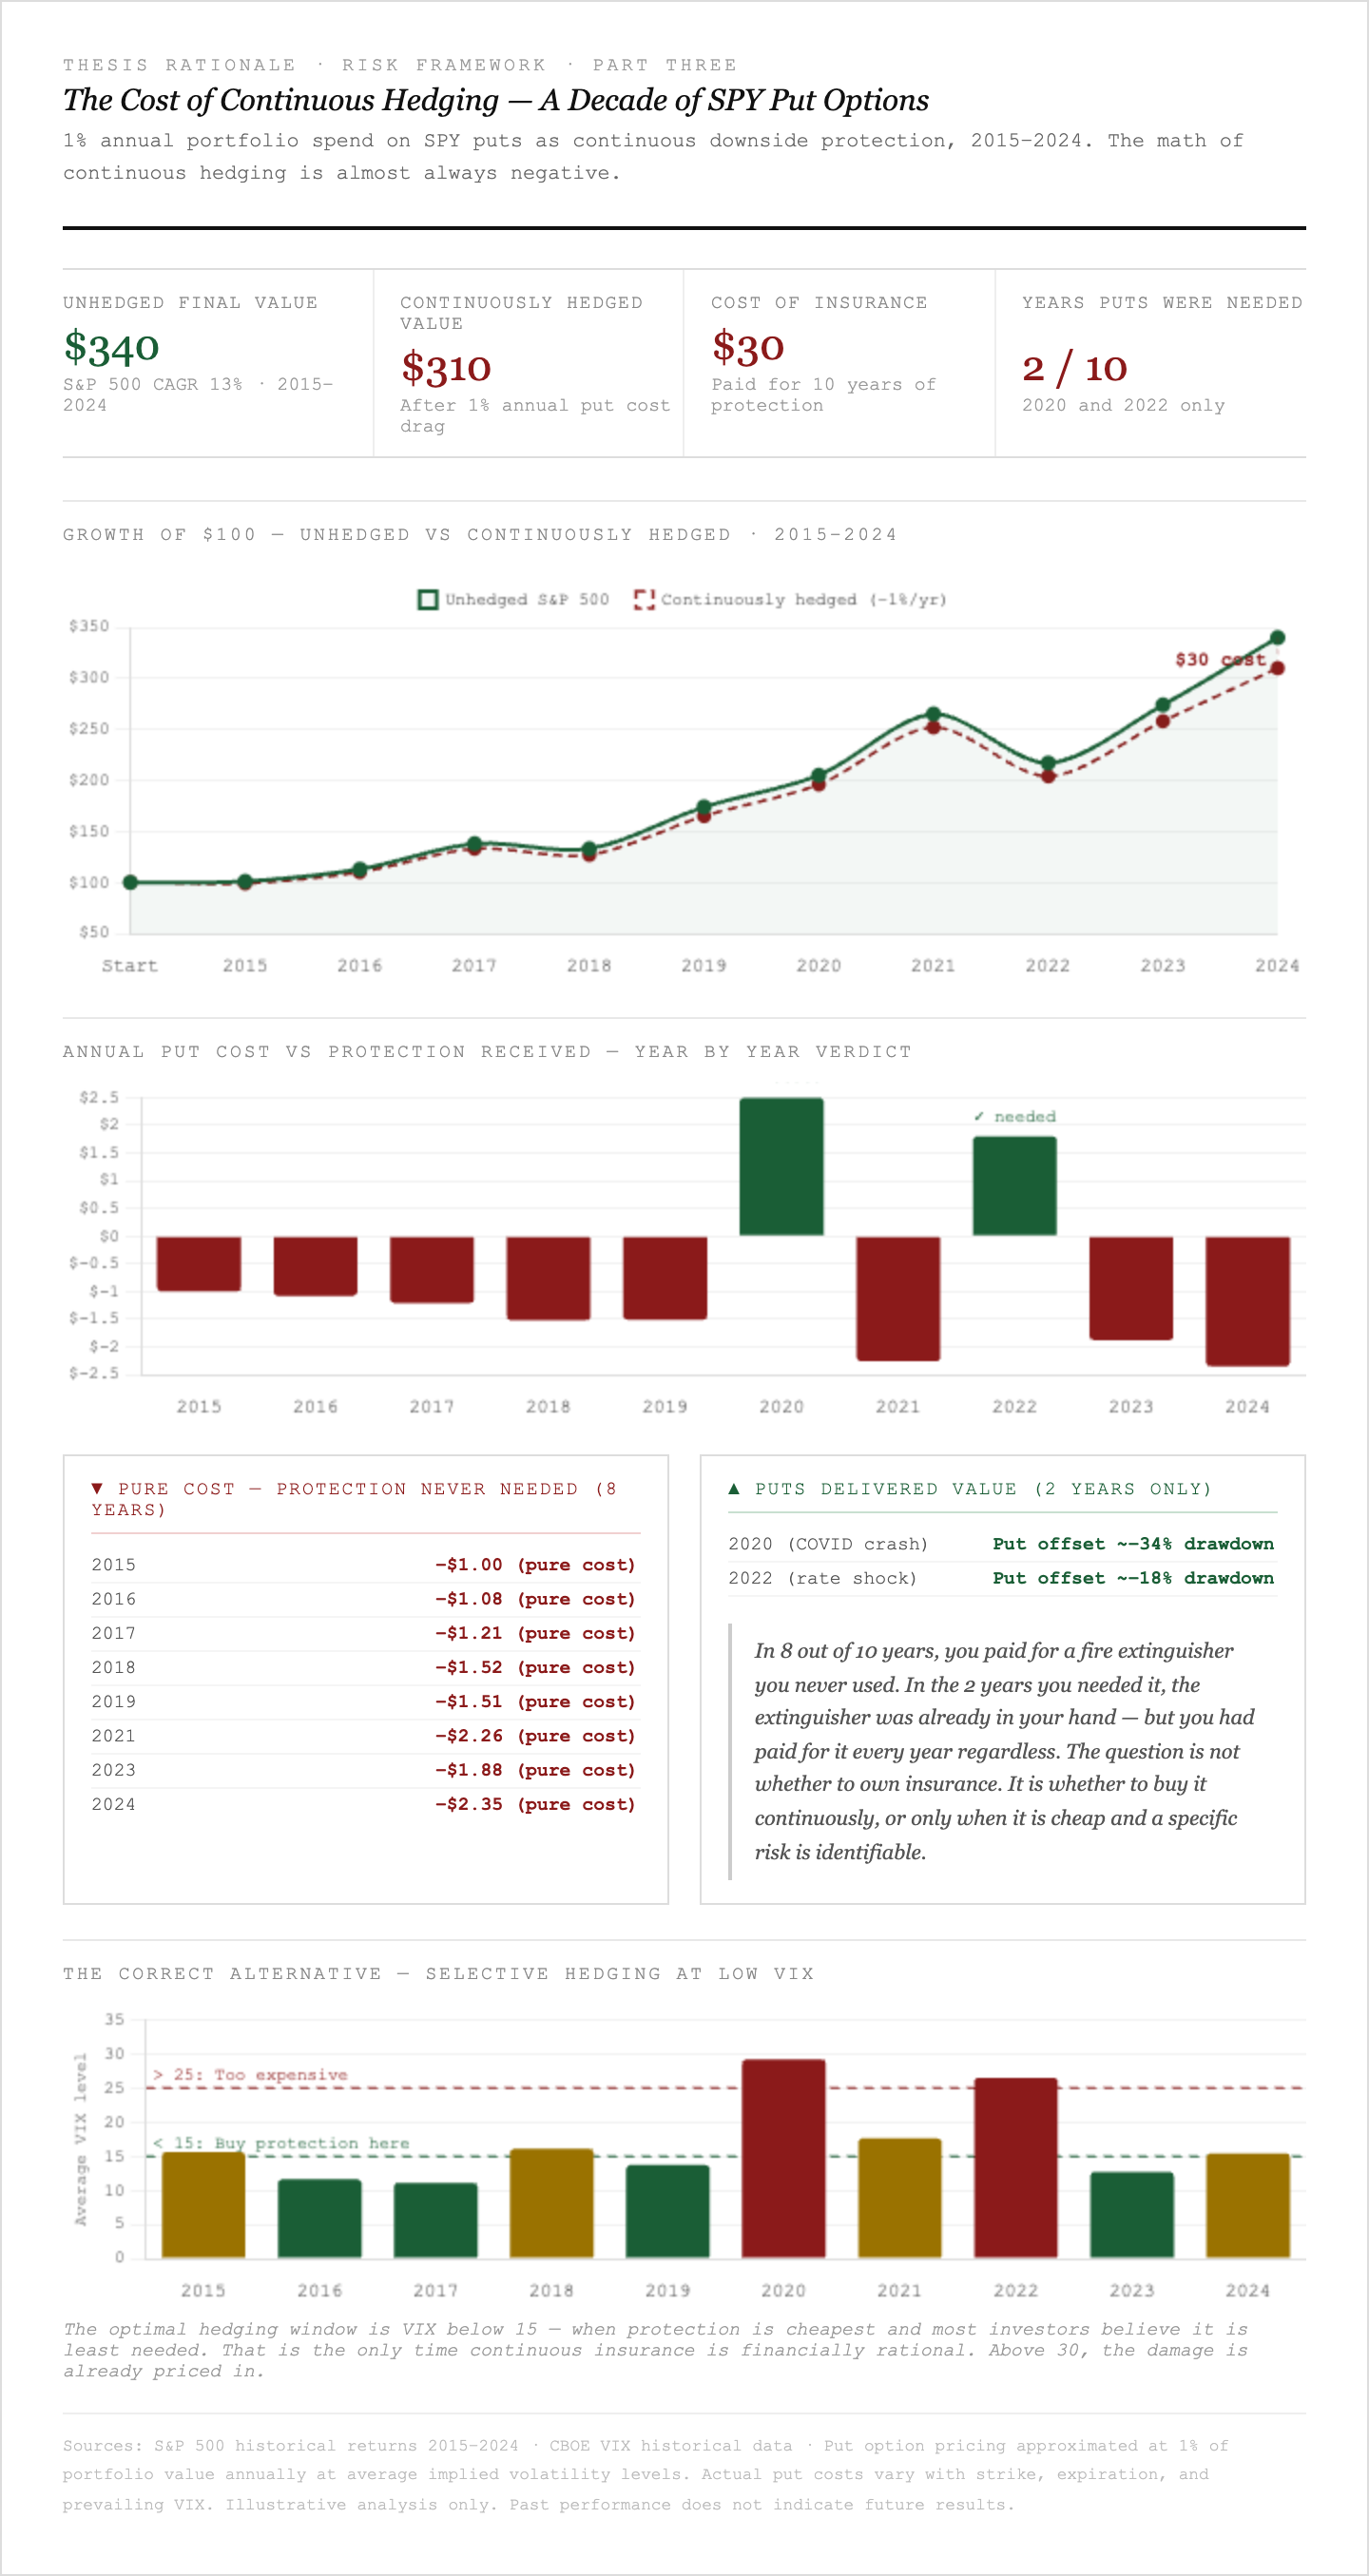
This does not mean hedging is wrong. It means continuous hedging is almost always wrong. The discipline is knowing precisely when the cost of protection is justified by the probability and magnitude of the risk being hedged, and executing in the one window when protection is actually cheap: before anyone else thinks they need it.
The Two-Layer Monitoring Framework
Before the specific triggers, the tools. Every hedging decision should be preceded by reading two distinct layers of market information, each answering a different question.
Layer One answers: Is protection cheap or expensive right now?
This layer determines the timing of any hedging action. The cost of protection is not constant. It varies enormously based on current market conditions, and buying protection at the wrong moment in the volatility cycle can make even a correct hedging thesis financially unworkable.
Layer Two answers: Has the macro environment changed structurally?
This layer determines whether a hedging action is warranted at all. Short-term price volatility and genuine structural shifts in the economic environment require completely different responses. Most situations that feel like they require hedging are the former. Only a small subset qualify as the latter.
Layer One: Hedging Cost Indicators
VIX and the VIX/VXV Ratio
The VIX measures the implied volatility of S&P 500 options over the next 30 days. In normal market conditions, it oscillates between 15 and 20. Above 30 signals significant market stress. The historical peaks tell the full story: during the 2008 financial crisis, the VIX reached 89.53. During the COVID crash of March 2020, it peaked at 82.69. During the April 2025 tariff shock, it spiked to its highest level since 2020 before subsiding.
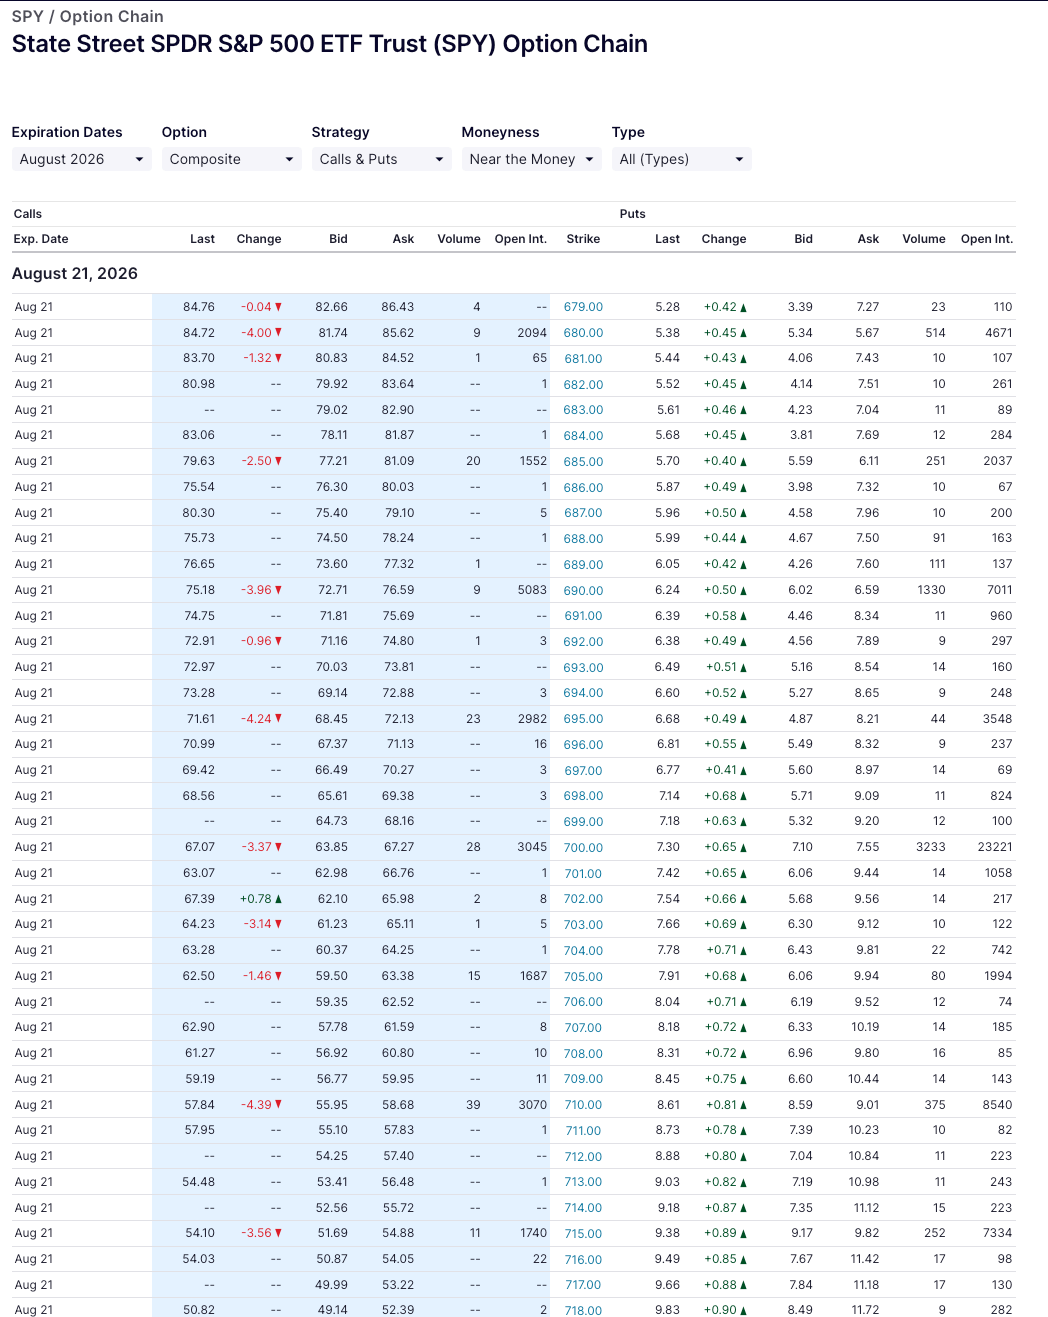
The implication for hedging is counterintuitive. When the VIX is at 80, Put Options are extraordinarily expensive. An at-the-money SPY put that costs $5 in a VIX-15 environment might cost $25 in a VIX-80 environment. The investor who waited until the crisis was visible to buy protection is paying five times the price for protection that is already too late to prevent most of the damage.
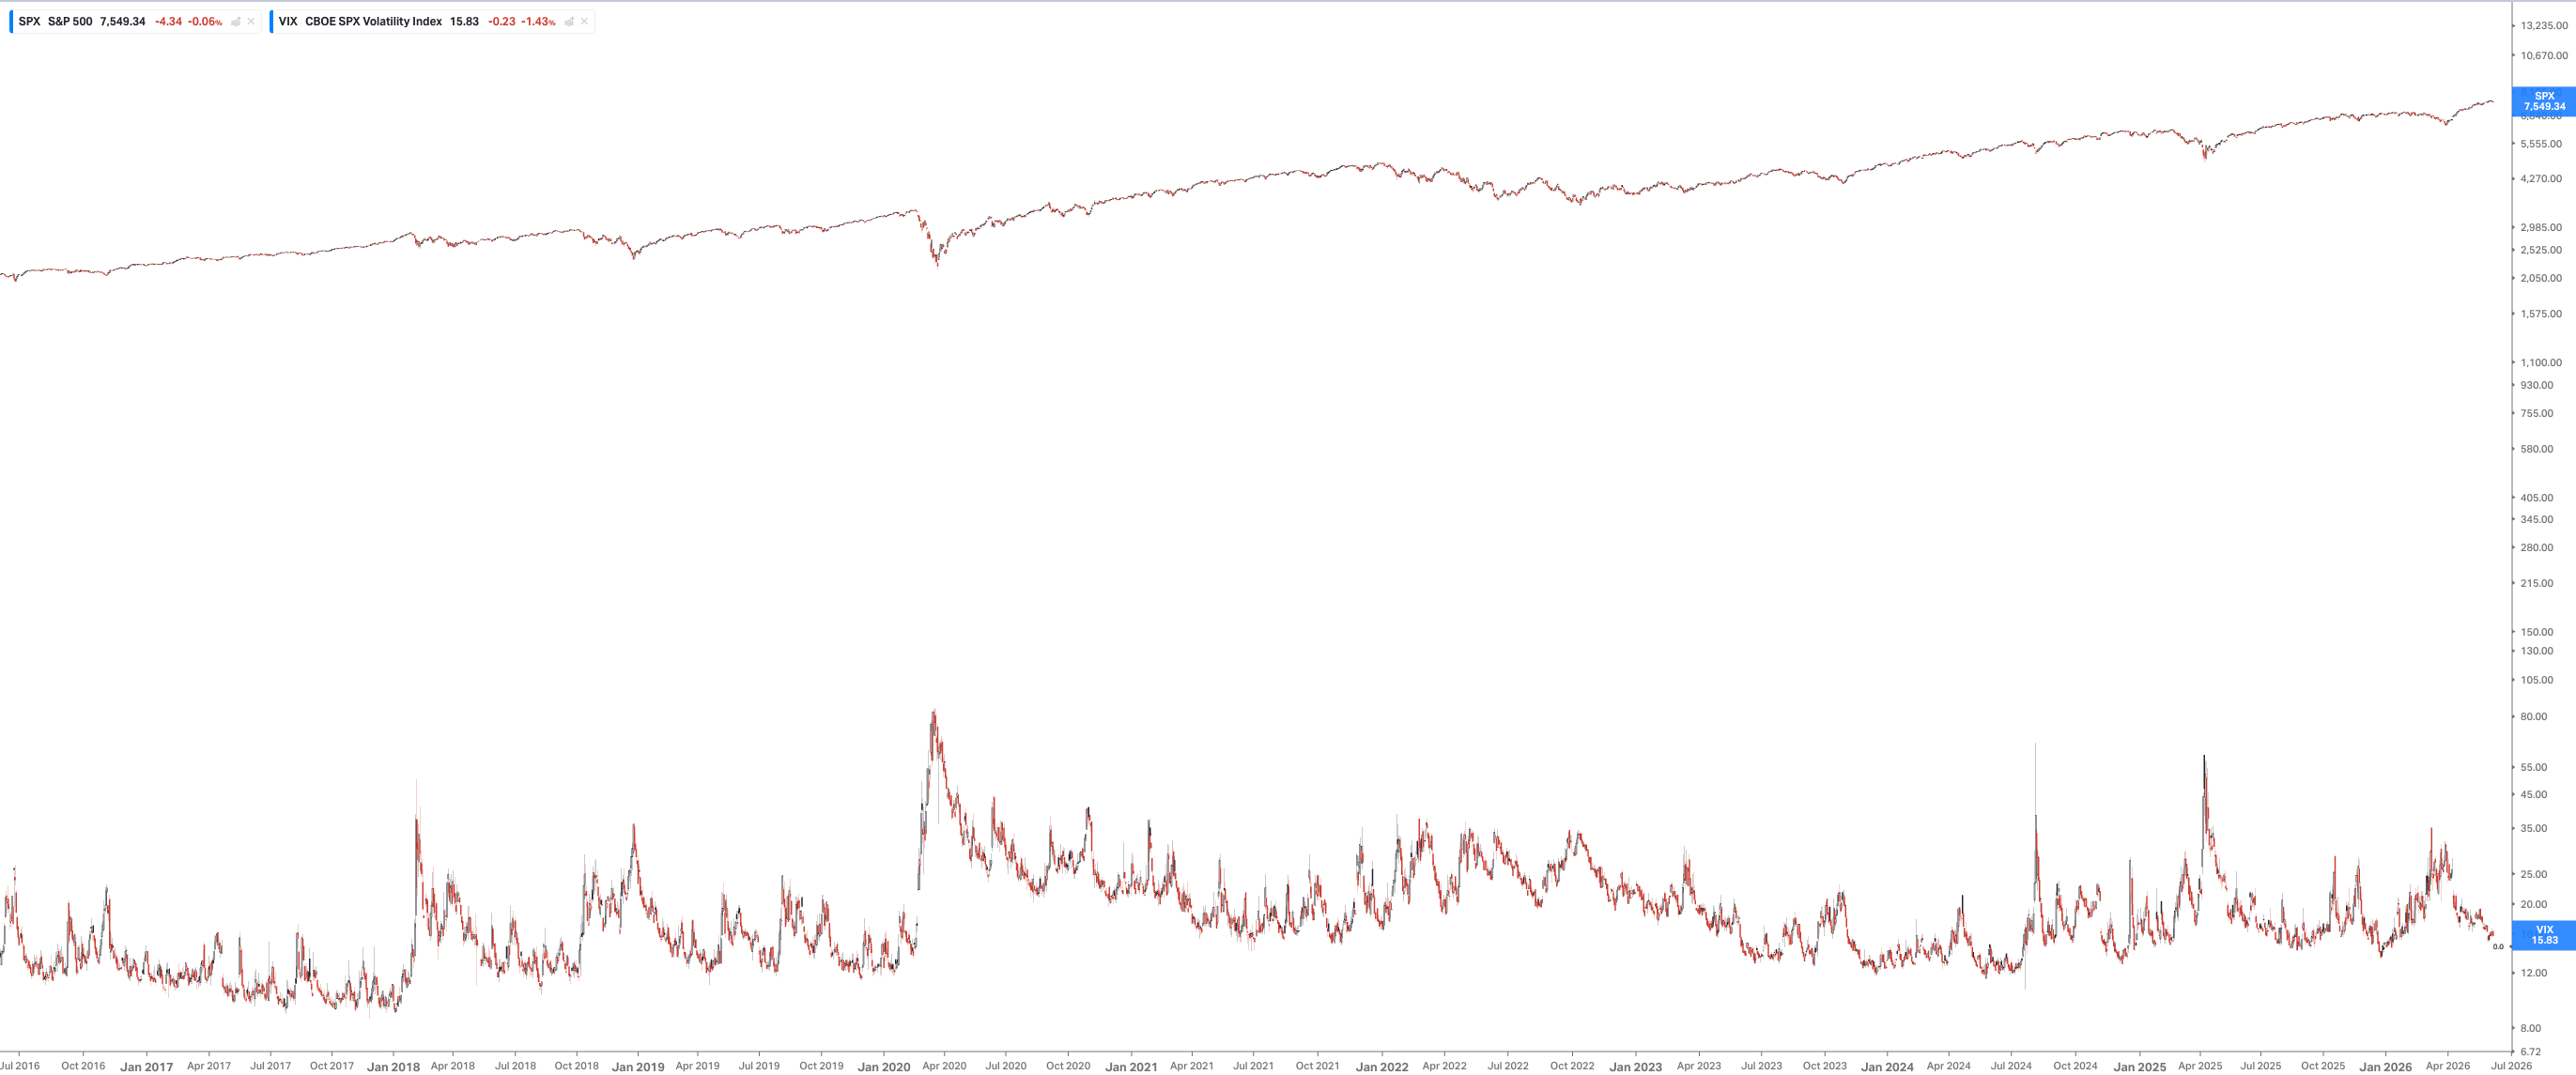
The optimal hedging window is VIX below 15, when protection is cheapest and the probability of a volatility event feels lowest. This requires the psychological discipline to buy insurance when nothing appears to be wrong, which is precisely why most investors never do it.
The VIX/VXV ratio is a more precise signal than the VIX alone. VXV measures three-month implied volatility, so the ratio captures the relationship between near-term and medium-term fear. When the ratio falls below 0.9, the market is more complacent about near-term risk than medium-term risk, a classic signal of self-satisfaction. When the ratio rises above 1.0, near-term fear exceeds medium-term concern, typically a sign of acute but transient stress rather than structural deterioration.
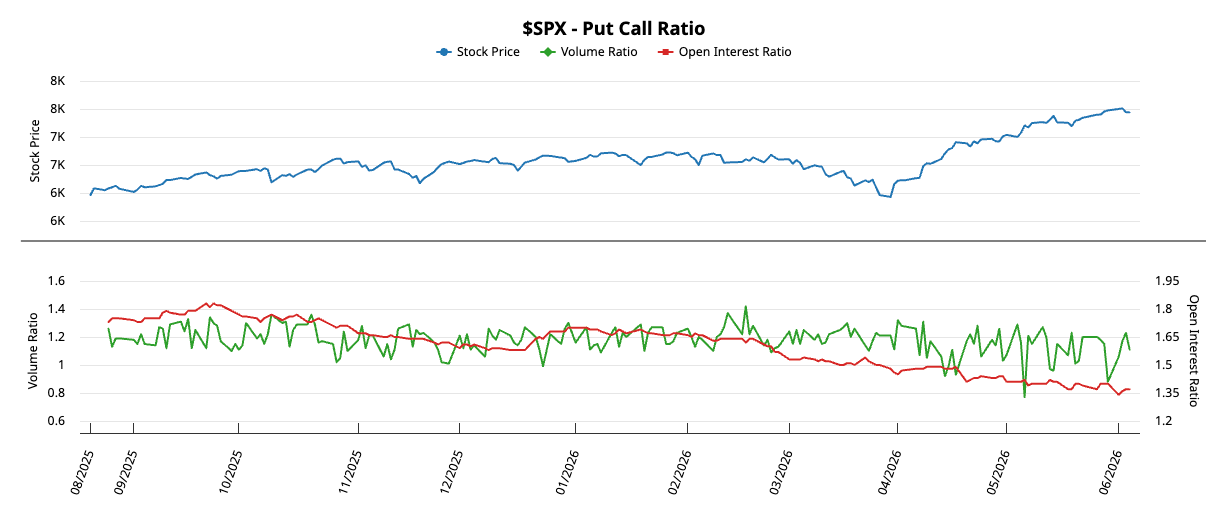
Put/Call Ratio
The Put/Call Ratio measures the volume of put options traded relative to call options on any given day. A high ratio means investors are buying protection aggressively. A low ratio means they are not. Because this is a contrarian indicator, extreme readings are the meaningful ones.
The historical reference point: the PCR hit its all-time low of 0.39 in March 2000, at the exact peak of the dot-com bubble. The market had never been more complacent about downside risk, and it had never been more wrong. When the 10-day moving average of the PCR rises above 1.1, markets have historically been near a trough. When it falls below 0.8, markets have historically been near a peak.
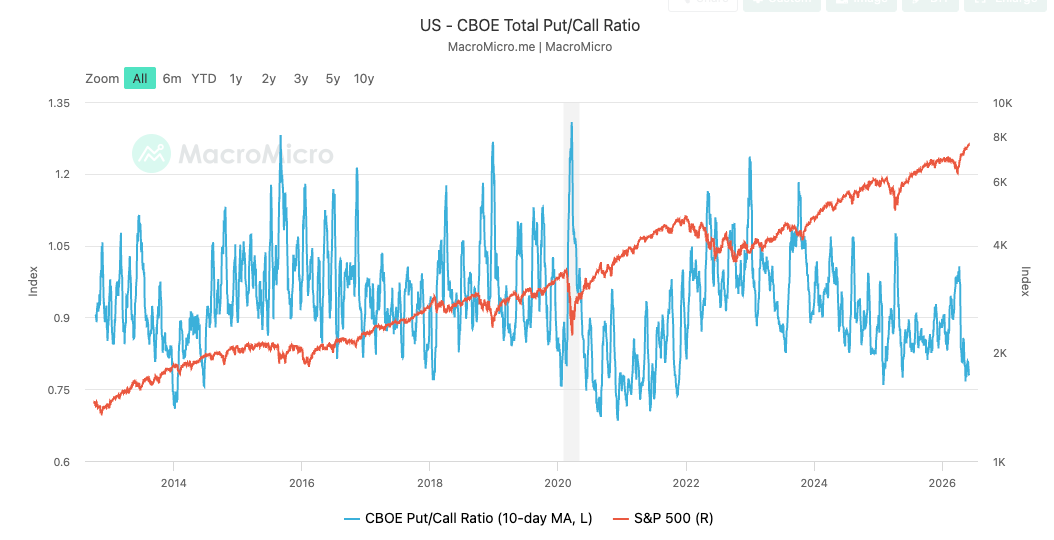
As of early 2026, the PCR weighted ratio had declined to its lowest level since the top of the prior bull market in late 2021, with persistently low readings reflecting call-heavy options activity. Such readings have historically been associated with corrections ranging from modest, around 9% to 10%, to significantly larger moves. Low PCR is not a precise timing signal. It is a condition that indicates the market is poorly positioned for downside surprise.
The practical application: a low PCR in combination with a low VIX is the most favorable environment for purchasing protective options. You are buying when supply is high and demand is low, which is the only rational time to purchase insurance.
Fear and Greed Index
The CNN Fear and Greed Index synthesizes seven market indicators into a single 0 to 100 reading, covering stock price momentum, new highs versus new lows, breadth, put/call ratios, junk bond demand, safe haven demand, and market volatility. At its peak in 2021, the index reached 97, deep into Extreme Greed territory, before the S&P 500 experienced its 18% drawdown in 2022. During the COVID crash of March 2020, it fell to single digits before the fastest market recovery in history.
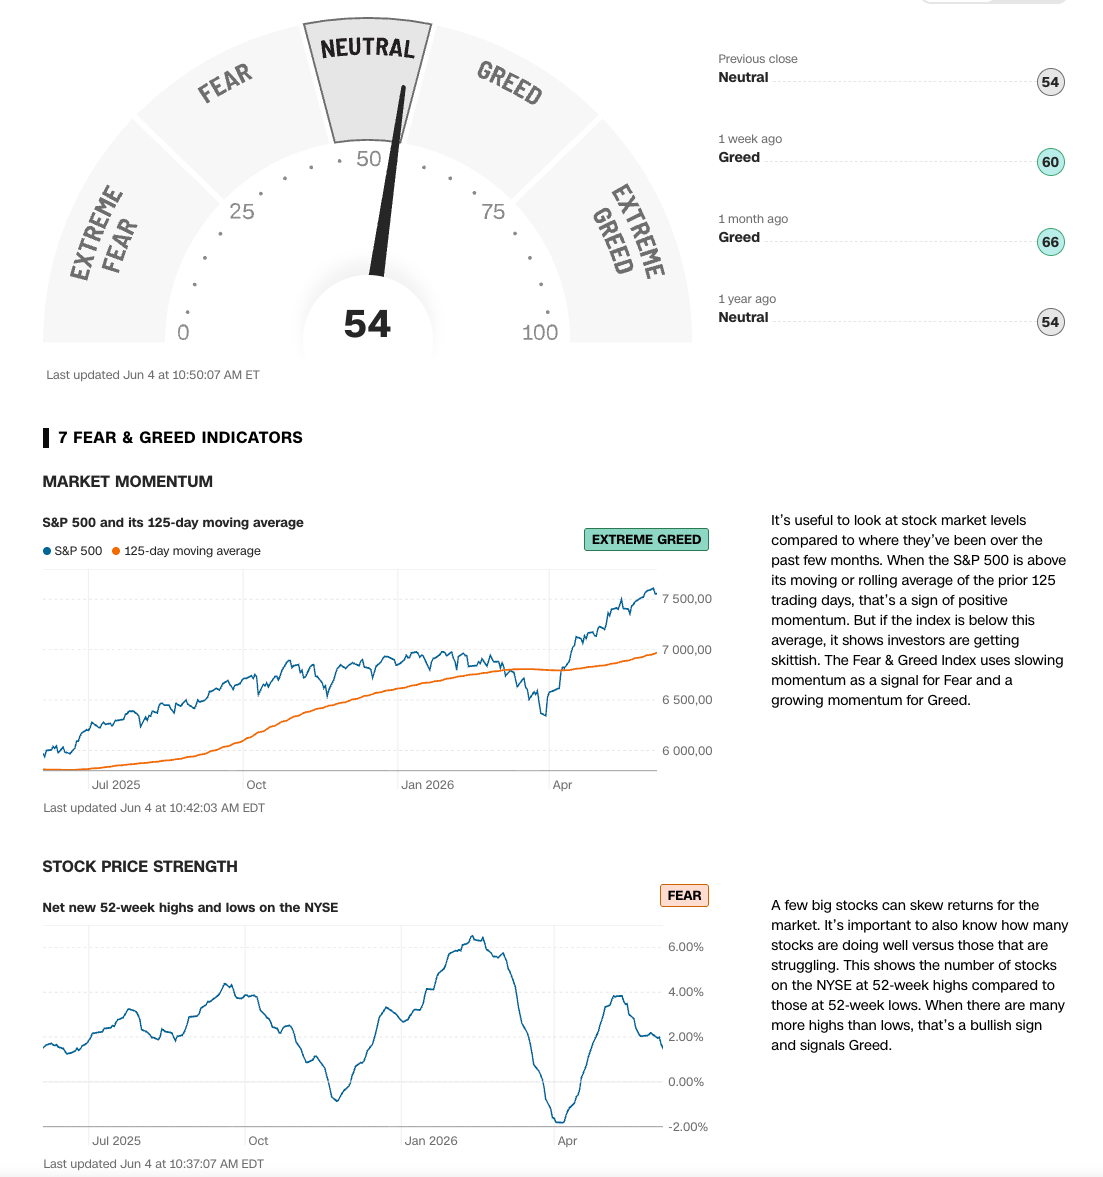
Three rules govern its use in a hedging framework.
First, only extreme readings carry signal value. Readings between 20 and 80 provide limited actionable information. The distribution of forward returns from neutral sentiment readings is barely distinguishable from random.
Second, the index is a confirming tool, not a standalone trigger. A Fear and Greed reading below 20 combined with VIX below 15 and PCR below 0.7 is a powerful convergent signal. Any one of these indicators alone is insufficient to drive a hedging decision.
Third, extreme greed does not predict the timing of a correction. Markets can remain in Extreme Greed for months or even years before a significant drawdown occurs. The index reading of 80 in June 2023 preceded continued market gains for another eighteen months. It is a measure of current vulnerability, not an imminent event prediction.
Layer Two: Structural Risk Indicators
Investment Grade Credit Spreads
Credit spreads are the single most important leading indicator available to equity investors, and the most underused. The mechanism is straightforward: institutional bond investors, who manage significantly more capital than equity investors and operate under strict risk mandates, react to deteriorating credit conditions before equity markets do. When they begin demanding higher yields to hold corporate debt, they are pricing in default risk that equity markets have not yet incorporated.
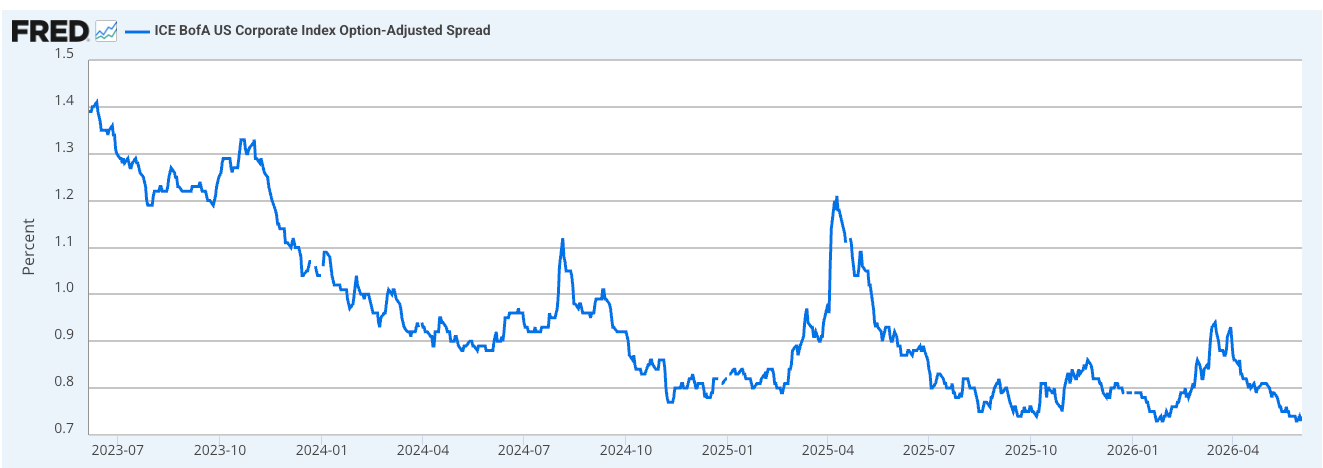
In 2007, investment grade credit spreads began widening in June, four months before the S&P 500 peaked in October. In late 2018, credit spreads widened through Q4 alongside the equity selloff, providing a concurrent confirmation rather than a leading signal. In 2022, the credit market was relatively slow to react because the primary driver was the rate shock, not credit deterioration, which is exactly when credit spreads are less predictive.
The practical rule: when IG credit spreads are widening while equity markets are still near highs, this is a structural warning that warrants a careful review of existing hedging levels. The divergence between calm equity markets and stressed credit markets has historically been a more reliable early warning signal than any volatility measure.
The inverse signal matters equally. When credit spreads compress to historically tight levels alongside equity market highs, this indicates that the fixed income market sees limited credit risk, which reduces the structural justification for broad equity hedges. Tight spreads alongside high equity valuations are not safe. They are a signal that both markets are simultaneously vulnerable to the same shock. But they reduce the asymmetry that makes hedging financially rational.
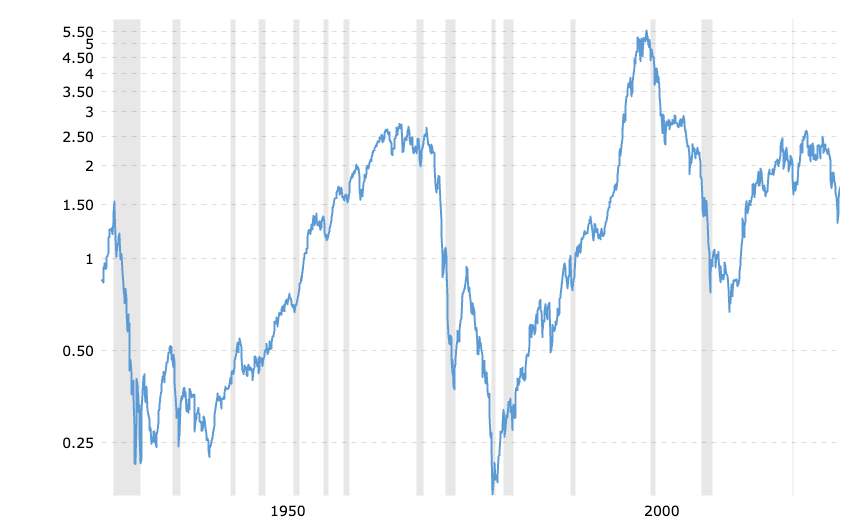
Shiller CAPE
The cyclically adjusted price-to-earnings ratio currently sits between 36 and 38, roughly double its historical average of 17 and approaching the levels seen at the peak of the dot-com bubble in 2000. This single fact does not tell investors to sell equities or buy puts. The CAPE has been “elevated” by historical standards for most of the past decade, and investors who exited equities on that basis missed extraordinary returns.
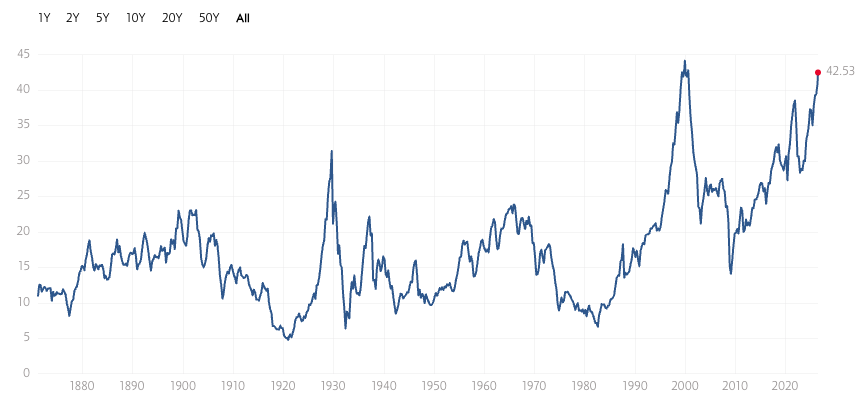
What CAPE actually measures is the forward margin of safety. At current levels, the historical distribution of 10-year forward returns suggests annualized returns in the 3% to 6% range rather than the 10% historical average. This has two specific implications for the hedging framework.
First, the Spare Tire tier of the portfolio should be at full allocation. In a low-return environment, the optionality value of deployable capital during a dislocation is proportionally higher. The opportunity cost of holding defensive assets is lower when overall equity return expectations are compressed.
Second, the tolerance for concentration risk should be lower. A portfolio that generates 20% annual returns through a concentrated, high-conviction position can absorb a 30% drawdown in that position without catastrophic consequences to the overall compounding trajectory. A portfolio in a 4% expected-return environment cannot absorb the same loss without permanent impairment.
CAPE does not trigger hedges. It calibrates how aggressively the rest of the framework should be applied.
Gold and the Gold/SPY Ratio
Gold’s behavior during market stress is not uniform, and understanding its different modes is essential to using it correctly as a risk signal.
When gold falls alongside equities, this is a liquidity crisis. Investors are selling everything to raise cash, and asset correlations collapse to 1. This is the most dangerous market environment and also the worst time to implement new hedging strategies. In March 2020, gold initially fell with equities before recovering as the Federal Reserve began its emergency interventions.
When gold rises while equities fall, this is traditional risk-off behavior. The bond market is functioning, credit spreads are manageable, and the decline is driven by risk aversion rather than forced selling. This environment is more structured and more amenable to systematic hedging responses.
The Gold/SPY ratio trend over a 12-month period is a useful structural signal. A rising trend suggests that real assets are being preferred over financial assets, typically associated with rising inflation expectations, currency debasement fears, or geopolitical risk premiums. A sustained ratio trend change in either direction is a prompt to review whether the portfolio’s Spare Tire allocation remains appropriate.
WTI Oil and PCE
