
The Risk Framework | Part 2: Position Sizing Is the Most Underrated Risk Management Tool You Have
Most investors obsess over what to buy. The investors who compound consistently obsess over how much to buy.

If you haven’t explored our previous research, you may revisit some of our earlier due diligence reports and thematic notes below. Each piece reflects the same thesis-driven framework we apply across every investment case.


For a closer look at how these principles translate into real positions, explore the 👉 Sample Portfolio — a demonstration of thesis-driven allocation and disciplined compounding.
Opening
There is a thought experiment worth sitting with.
Imagine two investors. Both own the same ten businesses. Both have done the same research, reached the same conclusions, and held the same conviction about each company’s long-term prospects. The only difference between them is how they sized their positions.
Investor A put 15% of their portfolio into their highest-conviction idea. Investor B put 5% into the same idea. When that idea turned out to be wrong, Investor A suffered a wound that took years to recover from. Investor B absorbed the loss and kept compounding.
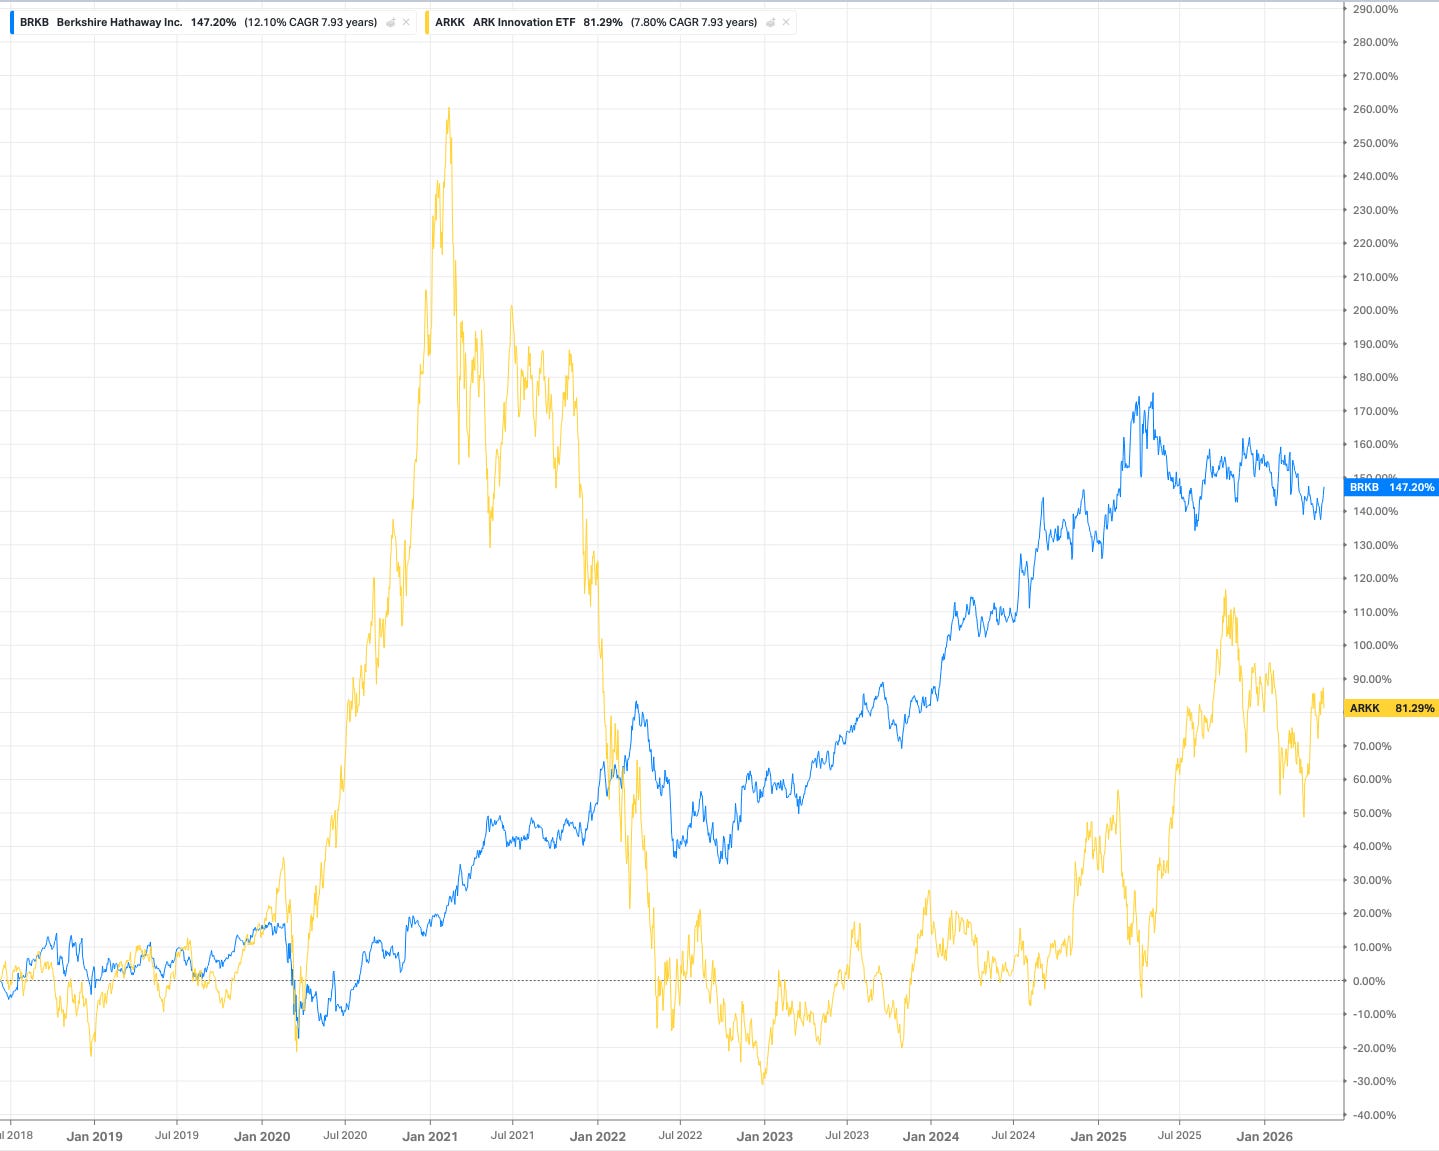
This chart tells the story better than any hypothetical can.
ARKK, the ARK Innovation ETF, peaked at +260% in early 2021. An investor who had put 15% of their portfolio into ARKK at launch, convinced by the innovation thesis and the extraordinary momentum, watched that position soar before collapsing back to below breakeven by 2023. Even today, after a partial recovery, ARKK sits at +81% over nearly eight years, a 7.80% CAGR. The investor who sized it at 15% spent years underwater, psychologically anchored to a peak they could not forget, and likely sold at the worst possible moment.
Berkshire Hathaway, over the same period, returned 147% at a 12.10% CAGR. No drama. No peak. No collapse. Just steady, compounding forward motion.
The investor who put 5% into ARKK and 5% into Berkshire absorbed the ARKK drawdown as a manageable event. The investor who put 15% into ARKK based on conviction alone did not just lose money. They lost time, confidence, and the ability to act when better opportunities emerged.
This is the central insight of this article: position sizing is not a capital allocation decision. It is a risk management decision. The size of each position in your portfolio determines how much damage any single mistake can cause, and how much any single success can contribute. Getting this right is not glamorous. It does not require sophisticated models or real-time data feeds. But done consistently and deliberately, it is the single most powerful tool available to a long-term investor, and the one most investors never think about systematically.
1. Why Position Sizing Is Risk Management
The conventional framing of risk management focuses on what you own. Is this business cyclical? Is this sector too concentrated? Is this company too leveraged? These are legitimate questions, but they are all questions about the quality of individual positions, not about the structure of the portfolio as a whole.
Position sizing asks a different question. Not “is this a good business?” but “given how good this business is, how wrong could I be, and how much of my portfolio can I afford to expose to that uncertainty?”
Consider what happens when position sizing is done poorly. A portfolio where three positions each represent 20% of total capital is not a diversified portfolio. It is a concentrated bet dressed up as diversification. If any one of those three positions experiences a thesis-breaking event, the portfolio suffers a loss that fundamentally impairs its ability to compound. The mathematics are unforgiving: a 20% loss in a position that represents 20% of the portfolio is a 4% hit to total capital. A 50% loss in the same position is a 10% hit. These are not small numbers when compounded over a decade.
Conversely, a portfolio where fifteen positions each represent a negligible fraction of total capital is so diluted that even correct decisions barely move the needle. This is the other failure mode, not too concentrated, but too dispersed to generate meaningful returns from good judgment.
The discipline of position sizing is finding the right answer between these two extremes, and finding it systematically, based on the specific characteristics of each position rather than on arbitrary rules or emotional conviction.
For the investment rationale behind each tier and the full portfolio architecture breakdown, see Part One of this series: Your Portfolio Architecture Is Your Risk Management. ⬇️
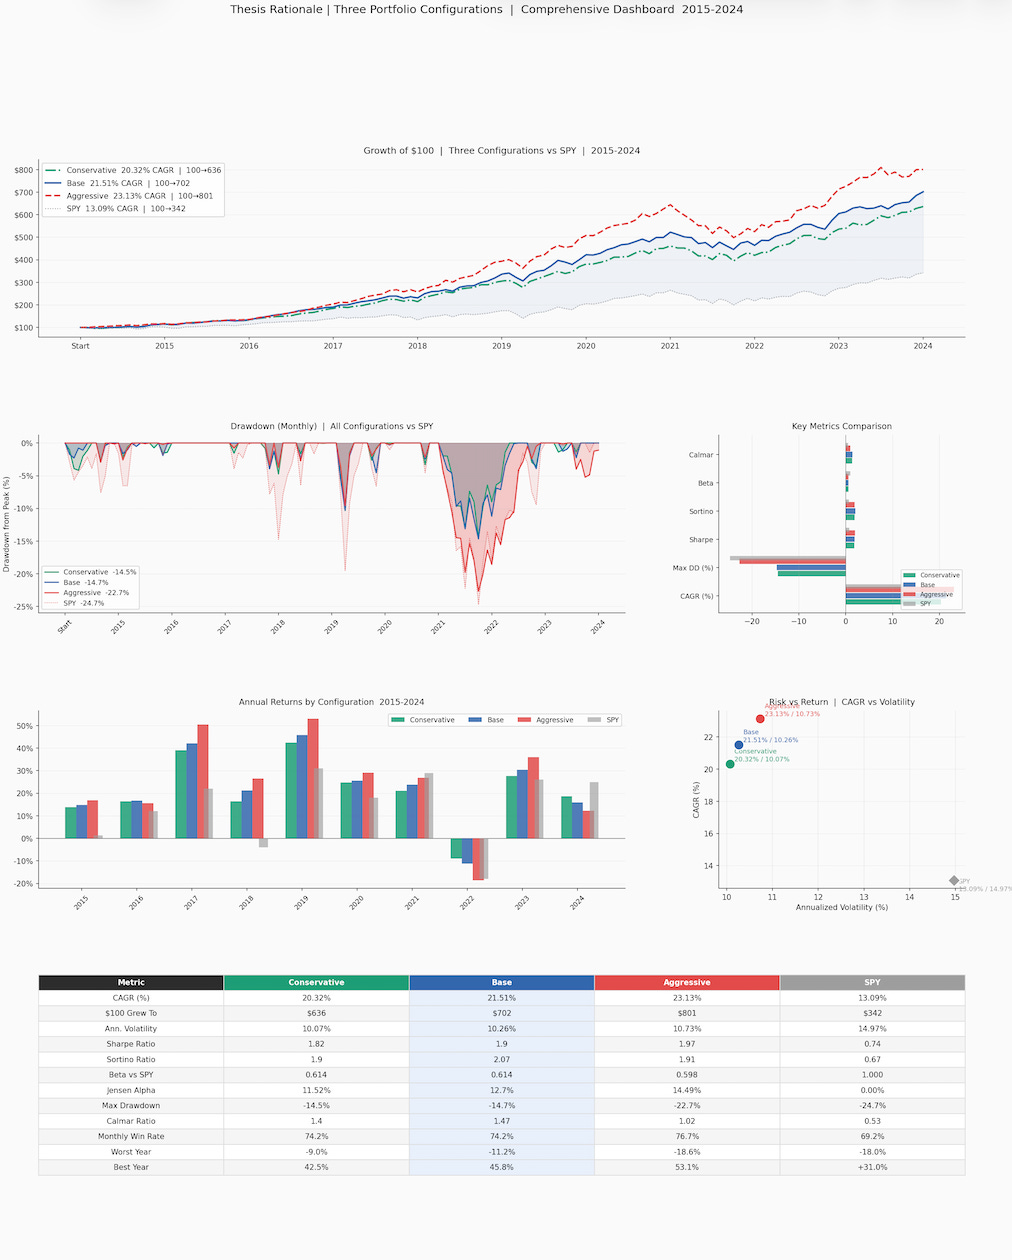
2. What Happens When You Change the Allocation
The power of understanding position sizing at the tier level becomes visible when you examine how different tier weightings change the overall portfolio’s risk and return characteristics. The racing car framework provides the conceptual structure. The data provides the proof.
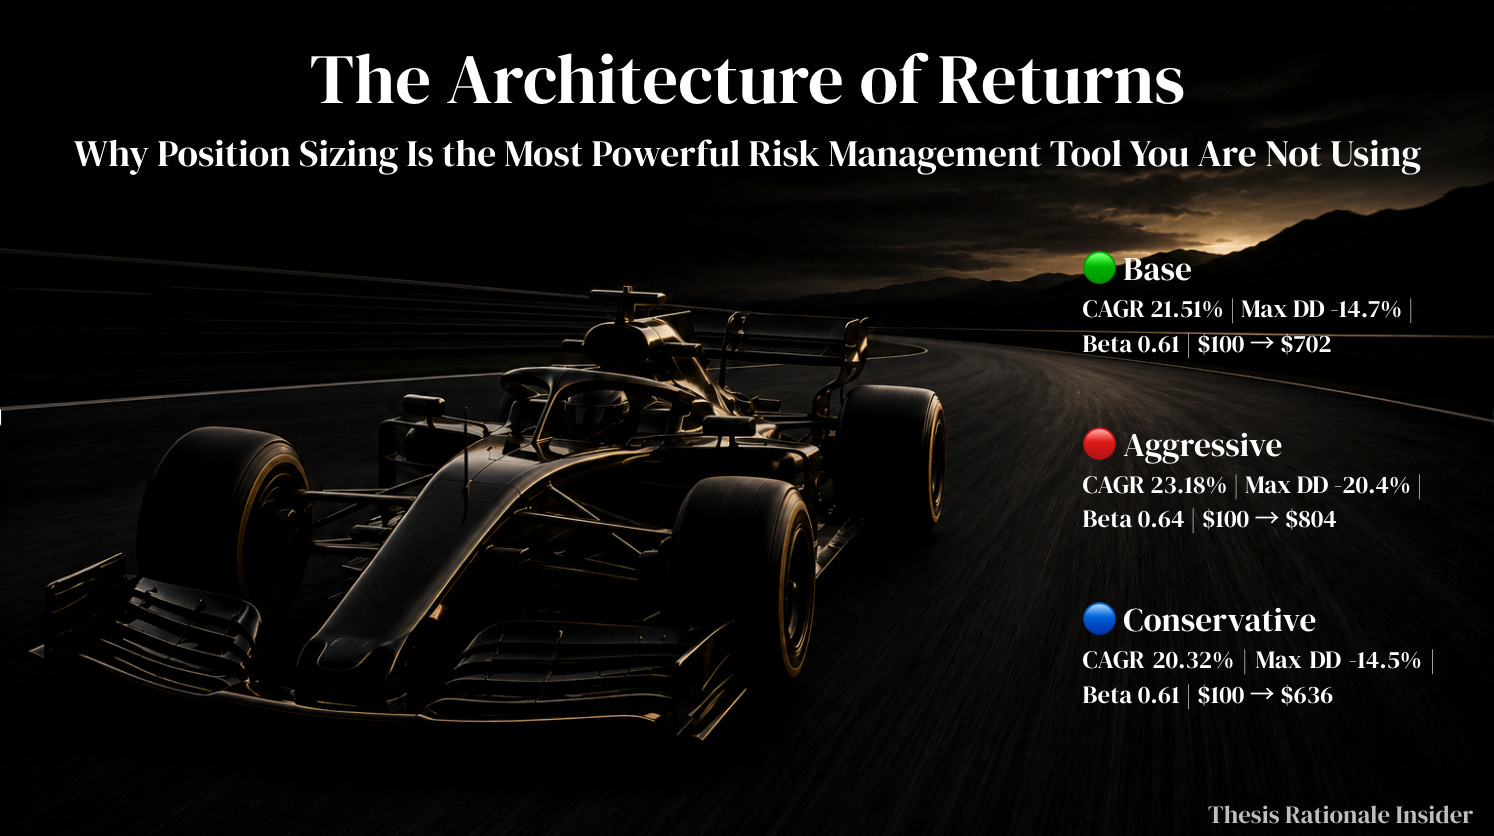
The base portfolio allocation, with Engine at 30%, Chassis at 20%, Tires at 20%, Turbocharger at 10%, and Spare Tire at 20%, delivered a CAGR of 21.55% against SPY’s 13.09%, with a Beta of 0.608 and a maximum drawdown of 15.8% over the ten-year backtest period.
🔴 Thesis Case 1: The Aggressive Configuration
Engine 40% | Chassis 20% | Tires 10% | Turbocharger 20% | Spare Tire 10%
This configuration pushes significantly more weight into the highest-returning tiers and removes weight from the defensive and stability layers. The Engine allocation increases by a third, the Turbocharger doubles, and the Tires and Spare Tire are both cut in half.
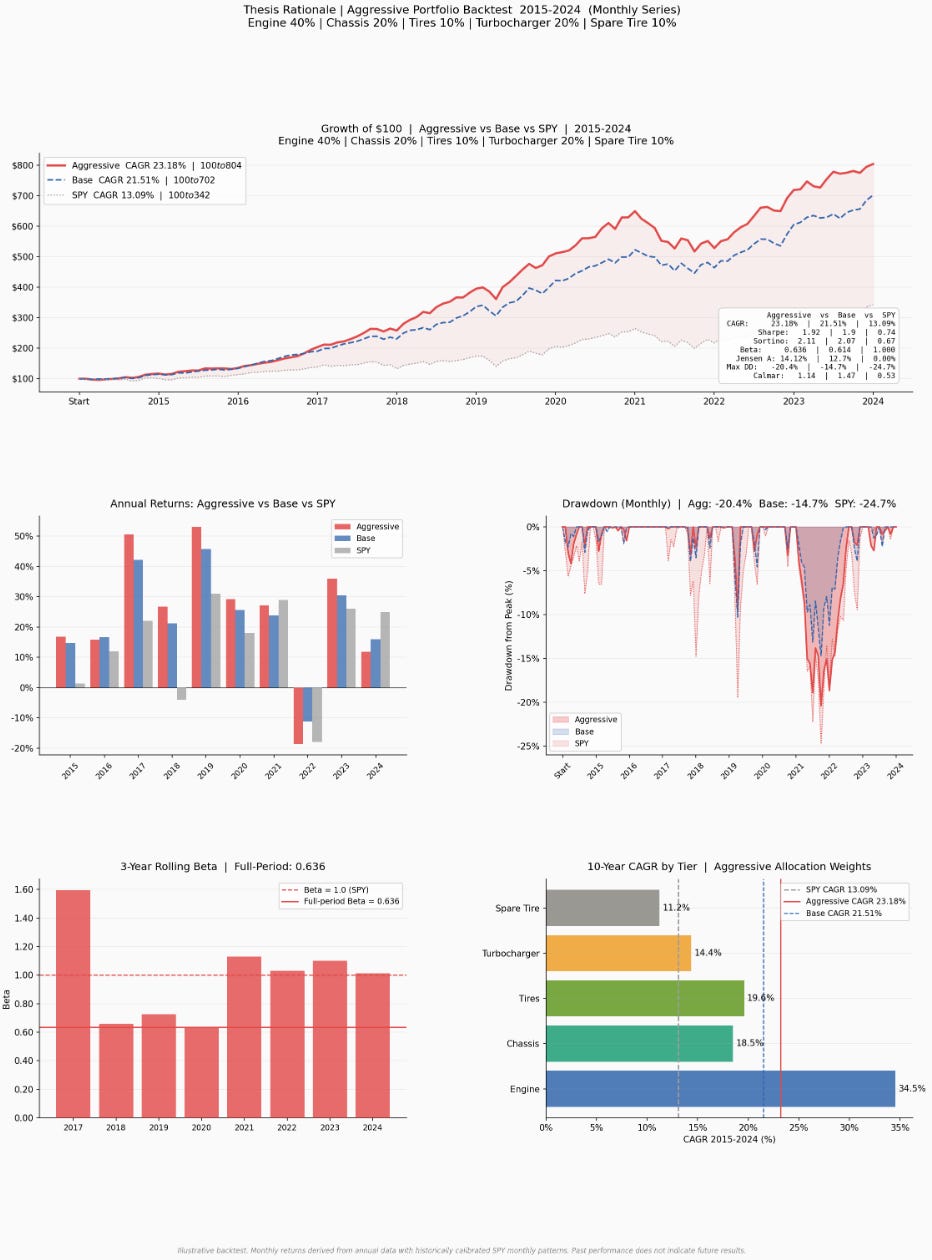
The backtest results for this configuration:
Thesis Case 1: The Aggressive Configuration
CAGR: 23.18% vs SPY 13.09%
Max Drawdown: -20.4%
