
Thesis Toolkits for Investors- The Fund-Style Portfolio Tracker You Can Built in Google Sheets
Bridging institutional portfolio discipline with accessible tools like Google Finance to help investors track, benchmark, and compound effectively.

With years of experience in fund management and investment research, we focus on bridging professional portfolio tools with practical, everyday investing. This piece demonstrates how even simple platforms like Google Sheets and Google Finance can be used with institutional discipline — tracking returns, benchmarking against indices, and building the foundation for thesis-driven investing.x
If you have not yet read our prior piece on thesis-driven investing, The Seven Categories of Intelligent Investing, it will provide useful context for today’s discussion.


Why This Matters
In professional fund management, clarity and discipline in data is not a luxury, it is a prerequisite.
While Bloomberg and FactSet remain the gold standard in institutional investing, individual investors today can achieve 70% of that functionality — for free — using Google Sheets with the GOOGLEFINANCE function.
The objective of this note is to show you, step by step, how to construct a live-updating portfolio tracker, calculate returns versus benchmarks, and visualize performance with institutional discipline.
Step 1: Building the Portfolio Framework
The first step is always structure.
In practice, a portfolio tracker should capture at minimum:
Ticker: stock symbol (e.g., AAPL, MSFT)
Initial Price: the price when you logged the investment
Current Price: fetched live via Google Finance
Holding Period: days since purchase
Return (%): cumulative return per stock
Notes: the thesis rationale — why you own this name
Remember: data without thesis is noise. The spreadsheet must always tie back to your investment reasoning.
Step 2: Google Finance Syntax

1. Core Identifiers
Ticker
The company’s stock symbol. This is the anchor for all subsequent functions.
AAPL, MSFT, GOOGCategory
Each stock is assigned to one of your thesis-driven categories (for example: Core Compounders, Defensive & Dividend Generators, Growth Leaders). This forces discipline: every holding must have a defined role.
2. Size and Price
Market Capitalization
=GOOGLEFINANCE(A2,"marketcap")Measures the scale of the business, critical for balancing large-cap stability versus small-cap growth exposure.
#,##0.00,,," B" It divides the value by 1,000,000,000 and shows it with two decimals followed by “B”
Price
=GOOGLEFINANCE(A2,"price")The current stock price, serving as the base for all calculations.
Currency
=GOOGLEFINANCE(A2,"currency")Essential for international holdings, ensuring awareness of FX exposure.
3. Historical Performance
Ten-Year Price Trend
=SPARKLINE(GOOGLEFINANCE(A2,"price",TODAY()-3650,TODAY(),"WEEKLY"))Provides a compact visualization of long-term durability.
One-Year Price Trend
=SPARKLINE(GOOGLEFINANCE(A2,"price",TODAY()-365,TODAY(),"DAILY"))Captures recent market behavior, momentum, and volatility.
4. Valuation and Earnings
Price/Earnings Ratio
=GOOGLEFINANCE(A2,"pe")A standard valuation metric. Useful for peer comparisons and for identifying extremes.
Earnings per Share (EPS)
=GOOGLEFINANCE(A2,"eps")Direct measure of profitability per share, the fundamental driver of long-term intrinsic value.
5. Momentum and Risk Indicators
Percentage Change (1m, 6m, 1y, 5y)
Formula for one month:
=(D2 - GOOGLEFINANCE(A2,"price",TODAY()-30)) / GOOGLEFINANCE(A2,"price",TODAY()-30)Similar formulas can be applied for six months, one year, and five years. These fields provide a clear view of whether a security is gaining strength or weakening relative to its category thesis.
52-Week High
=GOOGLEFINANCE(A2,"high52")52-Week Low
=GOOGLEFINANCE(A2,"low52")These serve as reference points for valuation and market psychology, highlighting whether the current price sits near extremes.
Here is the formula for calculating the 1-month return of the stock in cell A2:
= (INDEX(GOOGLEFINANCE(A2,"close",EDATE(TODAY(),-1),TODAY()),
         ROWS(GOOGLEFINANCE(A2,"close",EDATE(TODAY(),-1),TODAY())),2)
 - INDEX(GOOGLEFINANCE(A2,"close",EDATE(TODAY(),-1),TODAY()),2,2))
 / INDEX(GOOGLEFINANCE(A2,"close",EDATE(TODAY(),-1),TODAY()),2,2)
Breaking It Down
GOOGLEFINANCE(A2,"close",EDATE(TODAY(),-1),TODAY())
Pulls the daily closing prices from one month ago to today.
INDEX(..., ROWS(...), 2)
Selects the most recent price (last row, column 2).
INDEX(..., 2, 2)
Selects the starting price from one month ago (second row, column 2).
The formula then subtracts the two prices and divides by the starting price, yielding the percentage change over the past month.
3. Benchmarking Against the Market
No portfolio analysis is meaningful without a benchmark.
Use SPY (S&P 500 ETF) as baseline:
=GOOGLEFINANCE("SPY","price",DATE(2024,7,24))
=GOOGLEFINANCE("SPY","price")
From here, calculate SPY return over your holding period, and display it next to your portfolio return.
Institutional discipline requires relative returns, not just absolute performance.
4. Visualization
Once your data is live, build a line chart in Sheets:
X-axis: time (days)
Y-axis: portfolio value vs. SPY
Style: no grid background, clean white — think investment bank presentation, not classroom homework.
This produces exactly the type of cumulative return chart you’ve seen in hedge fund tear sheets.
Educational Insert: Why This Matters
Remember:
Tracking is not about cosmetics. It is about behavior.
A disciplined tracker forces you to:
Confront your assumptions against reality.
Avoid hindsight bias (“I knew it all along”).
Anchor decisions on data, not emotion.
This is how professional investors sustain compounding — not just by stock picking, but by measuring relentlessly.
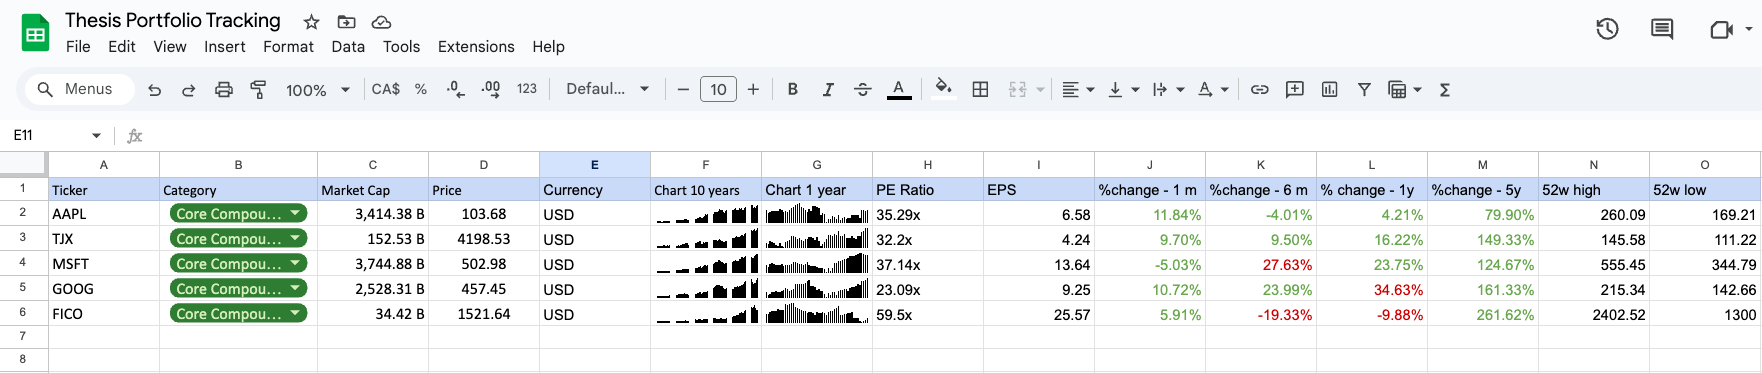
Example: Portfolio Snapshot
Final Thought
You don’t need Bloomberg to invest with discipline. What you need is a thesis, a structure, and the humility to track yourself honestly. Google Finance is not perfect — data lags, and coverage gaps exist — but for 90% of investors, it is more than enough.
Discipline is not about predicting the future. It is about confronting reality in real time. A portfolio tracker is not a gadget — it is your accountability partner.
Extra sources: Google Finance on Google Sheet